Mapping MDE and Windows Security Events overlap

Introduction
In my last blog post, I talked about using MITRE ATT&CK to support Microsoft Sentinel use cases. Today, I will be showing you how we can compare data coverage of data sources in Sentinel with MITRE ATT&CK and OSSEM. In this post you will find guidance about how to plot the MITRE ATT&CK data coverage of Windows Security Events and Microsoft Defender for Endpoint, so we can see the overlap between the two and hopefully can choose which data source to use.
Plotting MITRE ATT&CK layers for data sources
The reason I started this project was because I wondered what overlap there is between Microsoft Security Events data and Microsoft Defender for Endpoint data. When a customer has all endpoints and servers deployed in Microsoft Defender for Endpoint, is it still necessary to ingest certain Windows Security Logs in Microsoft Sentinel?
The OSSEM data model
My first question was, how am I going to know which data there is available in both Windows Security Events and MDE events? After some googling, I found the awesome OSSEM project that is focusing on documenting and standardizing security event logs from diverse data sources.
In this project, you have the Detection Data Model that focuses on defining the required data in form of objects and relationships among each other, which is needed to facilitate the creation of data analytics and validate the detection of advisory techniques. On this GitHub page, you can find the techniques_to_events_mapping that contains event types from various data sources, the relationships between them, and to which MITRE Techniques to map. And guess what, Windows Security Events and MDE events are included in the mapped data sources!
I will not go into detail about how the OSSEM model is set up and how it works, but I will cover some basics. If we use Windows Event Logs as an example, you get the following schema:
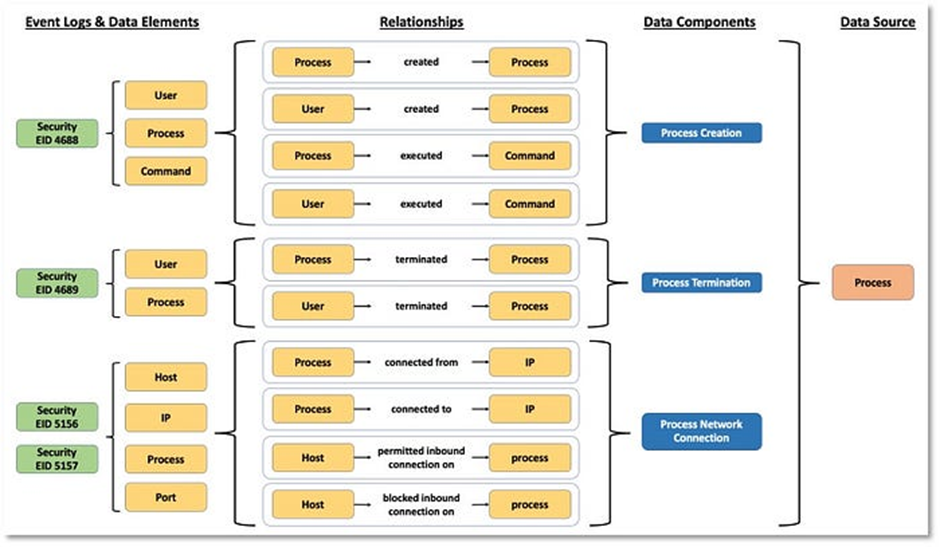
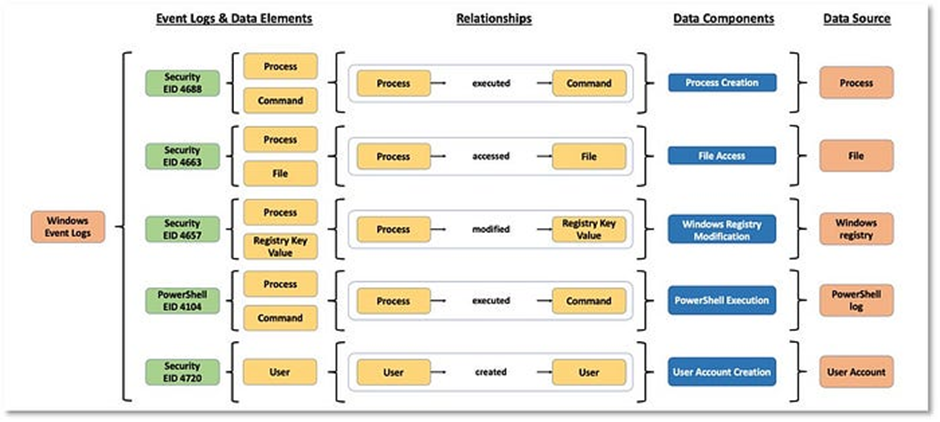
We start with the different event logs on the left side. Every event log has one or more data elements to which it relates (Processes, Commands, Files, etc.). Every data element then may have multiple relationships with each other (process created process, user created process, etc). Based on these relationships, a data component is decided (process created, process termination, etc). And finally, the data source is mapped (process, user, network, etc). Another schema of different data sources can be found below:
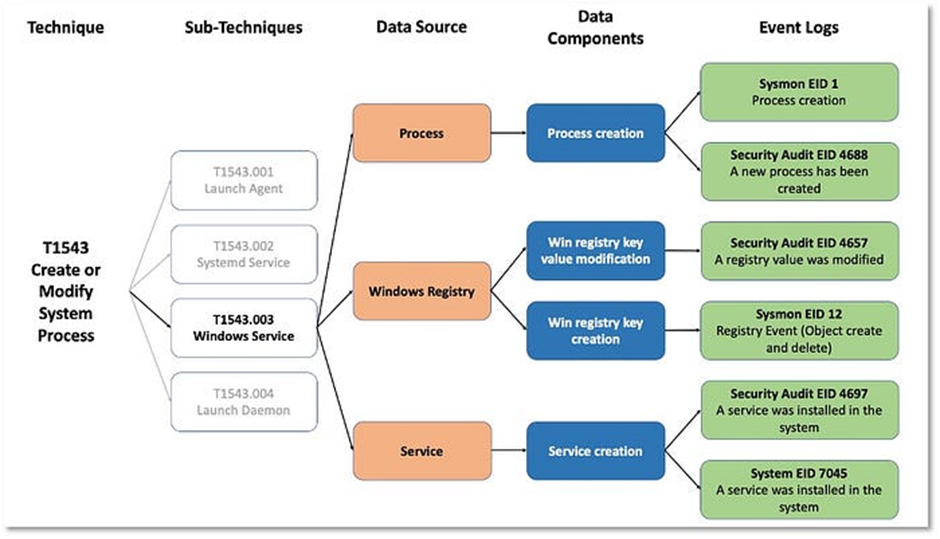
The data model then aligns the methodology with MITRE ATT&CK, so different sub-techniques can be mapped to the corresponding data components.
If you want to know more about the OSSEM model, make sure to check the following references:
- https://medium.com/mitre-attack/defining-attack-data-sources-part-i-4c39e581454f
- https://medium.com/mitre-attack/defining-attack-data-sources-part-ii-1fc98738ba5b
- https://github.com/OTRF/OSSEM
- https://ossemproject.com/intro.html
The yaml models
The first model I want to show is the attack_relationships model where you can find all of the events of different data sources and their relations with each other:
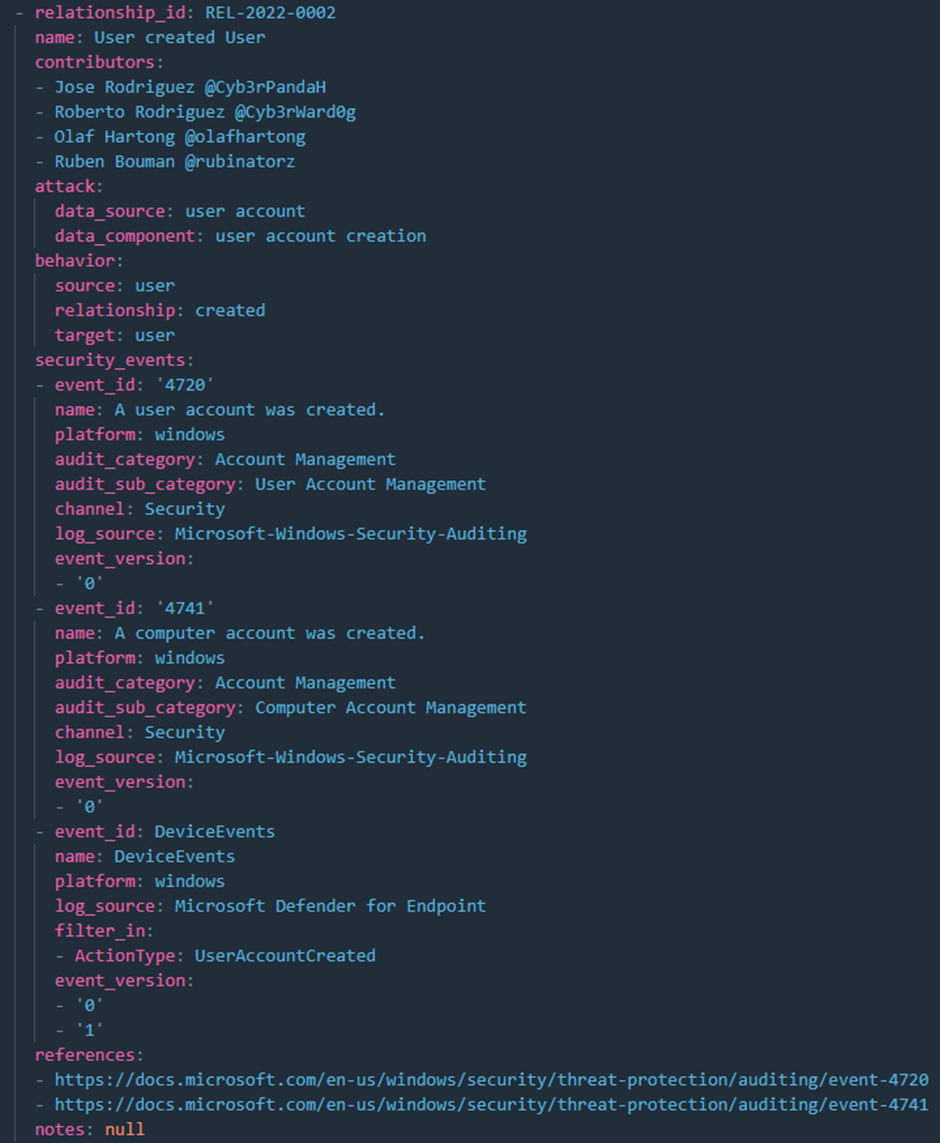
The second model is the model we will be using. This model is the techniques_to_events_mapping model which contains a mapping of every eventid over the different data sources to the related MITRE ATT&CK technique or sub-technique:
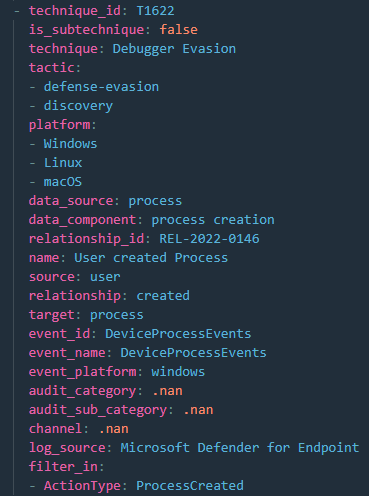
In the screenshot above you see a mapping of DeviceProcessEvents of Defender for Endpoint to technique T1622. Know that the file contains an enormous number of related objects where the same and other events are mapped to one or multiple techniques and sub-techniques.
Importing the data
On this page of the OSSEM website, you will find some examples of how to import the techniques to events mapping and how you can manipulate them. They are leveraging python to get the data and create insights about the mappings. In all of the examples below you will find my code that is based on the examples of the OSSEM website.
First, we have to import some libraries. These are used to get the data and transform the data into a model that is easy to manipulate and visualize.
# Importing library to manipulate data
import pandas as pd
# Importing library to manipulate yaml data
import yaml
# Importing library to create requests
import requests
# Import library to manipulate json data
import json
# Import library to copy objects
import copy
# Importing library for visualizations
from openhunt import visualizations as vis
Now that the libraries are imported, we can get the data and create the mapping to manipulate:
# Get OSSEM-DM techniques mapping file
yamlUrl = 'https://raw.githubusercontent.com/OTRF/OSSEM-DM/main/use-cases/mitre_attack/techniques_to_events_mapping.yaml'
# Parse the data
yamlContent = requests.get(yamlUrl)
yamlMapping = yaml.safe_load(yamlContent.text)
# Map the data
mapping = pd.json_normalize(yamlMapping)
As you can see, we normalized the data model with the pandas library and saved the normalized mapping to the mapping variable. This variable will be used to create our visualizations and manipulations.
Visualizing the data
There are a couple of visualizations you can create to help troubleshoot and understand the data set more. The first one is the table representation of the data set. This really helps you to understand how the data set works, which properties there are per object, and more. You can filter on a value in a certain column, or you can combine multiple column filters. Below you find an example of a filter on one column:
mapping[(mapping['event_id']=='4724')]
A filter on multiple columns is shown here:
mapping[(mapping['technique_id']=='T1448.002')][(mapping['event_id']=='5136')]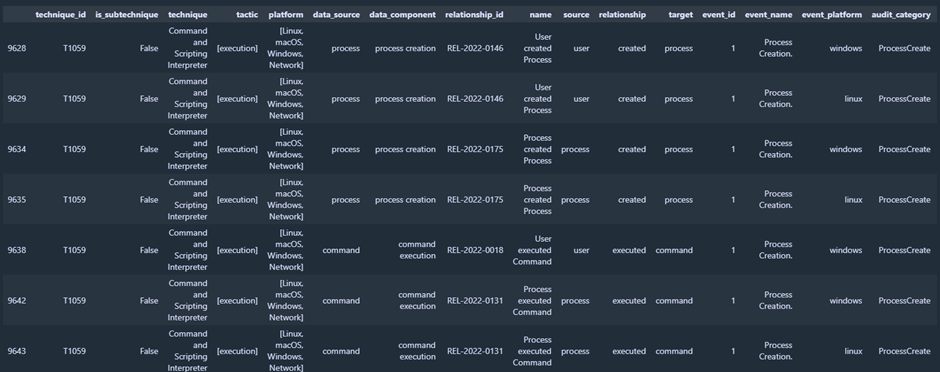
The second one is the attack_network_graph visualization that plots the graphical connections between the different mapping objects. The following command creates the visualization of all related nodes connected to technique T1059.
vis.attack_network_graph(mapping[(mapping['technique_id']=='T1059')])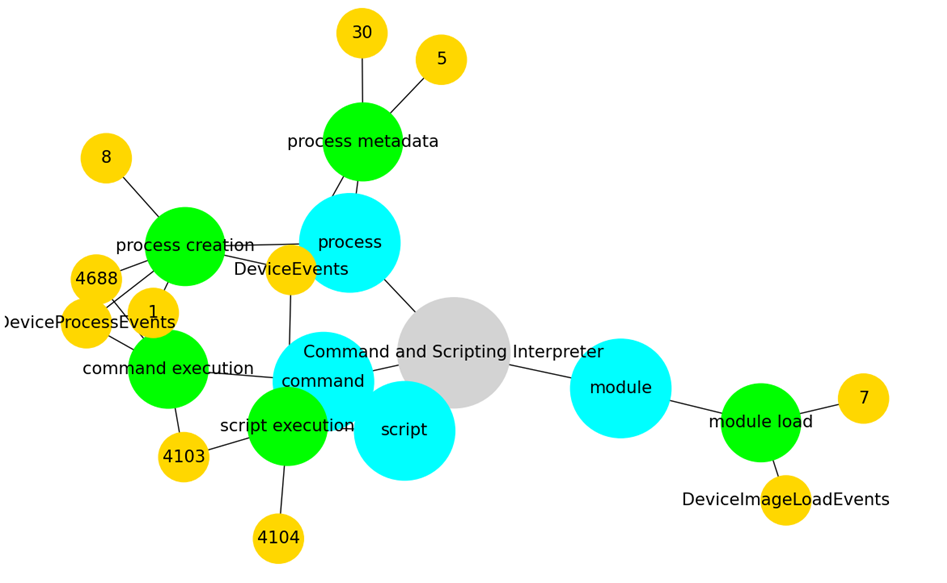
Creating MITRE layers
Now that we have covered the basics of the OSSEM model, we can create MITRE layers for certain filters. I created a python script that can manipulate the OSSEM mappings, to create relevant MITRE layers based on chosen filters. For example, let's say we want the MITRE ATT&CK layer for all the Microsoft Defender for Endpoint Events and Microsoft Windows Security Events there are. For this, I use the code below.
# Microsoft Defender for Endpoint layer
techniques = get_mitre_techniques_by_filter(filterType='log_source',filterString='Microsoft Defender for Endpoint', techniquesArray=[], commentProperty='name')
create_mitre_mapping(techniques=techniques, template=mitre_layer, filename='Microsoft Defender for Endpoint.json')
# Microsoft-Windows-Security-Auditing layer
techniques = get_mitre_techniques_by_filter(filterType='log_source',filterString='Microsoft-Windows-Security-Auditing', techniquesArray=[], commentProperty='name')
create_mitre_mapping(techniques=techniques, template=mitre_layer, filename='Microsoft Windows Security Auditing.json')
As you can see, I created two functions called 'get_mitre_techniques_by_filter' and 'create_mitre_mapping'. If you are interested in the code, let me know in the comments section and maybe I will share the GitHub repository later ?.
The output you get is the MITRE layer for the relevant filter that you can import in the MITRE ATT&CK Navigator.
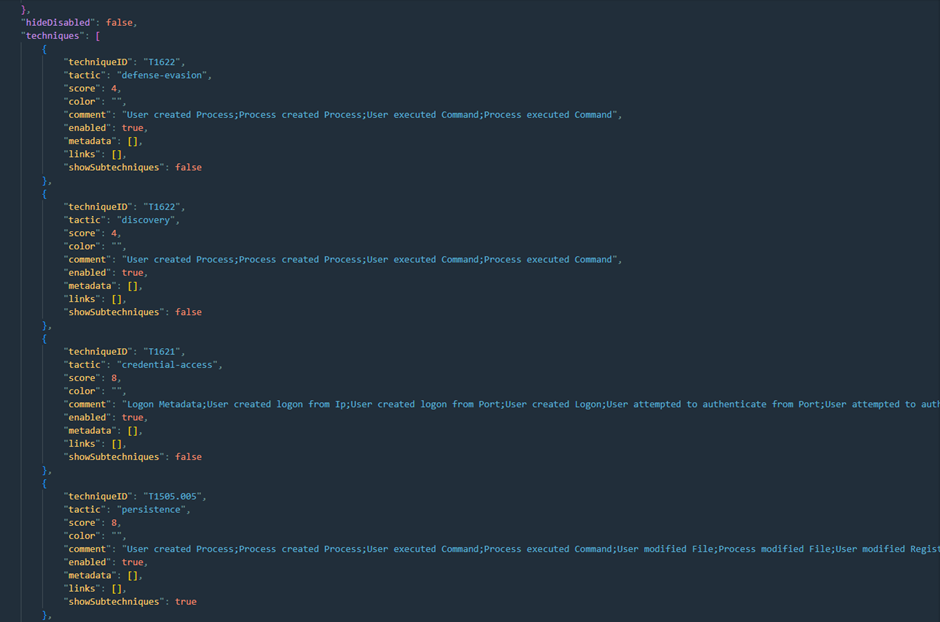
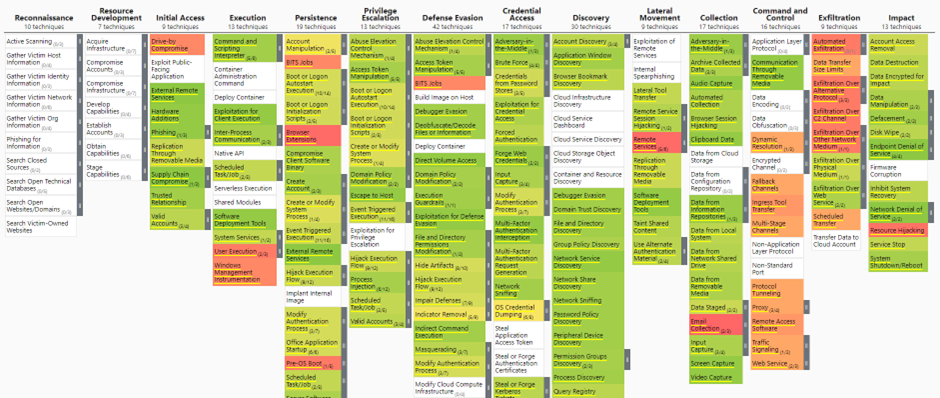
An explanation of the different parameters you can set in the get_mitre_techniques_by_filter function can be found below:
- filterType – This parameter lets you choose on which column you want to filter.
- filterString- This parameter is the string you will be searching for in the column you set in the FilterType parameter
- techniquesArray – The techniques array is an array you can provide if you already have a technique by filter array you want to reuse. This is typically empty or is an array that was created by the get_mitre_techniques_by_filter function itself.
- commentProperty – This is the column you want to include in the comments section of the techniques and will be the column that will be counted for the score of the layer
The score
Every technique that is present in the mapping layer gets a score. The score is the number of occurrences where the string in the commentProperty parameter maps to the relevant technique. For example, in the below command, we will count how many values in the 'name' column maps to the techniques that are included in the Microsoft Defender for Endpoint log source:
# Microsoft-Windows-Security-Auditing layer
techniques = get_mitre_techniques_by_filter(filterType='log_source',filterString='Microsoft-Windows-Security-Auditing', techniquesArray=[], commentProperty='name')
create_mitre_mapping(techniques=techniques, template=mitre_layer, filename='Microsoft Windows Security Auditing.json')
In the layer, we see that T1622 under Defender Evasion has a score of 4. This is because there are 4 occurrences in the 'name' column of the mapping that relates to this technique:
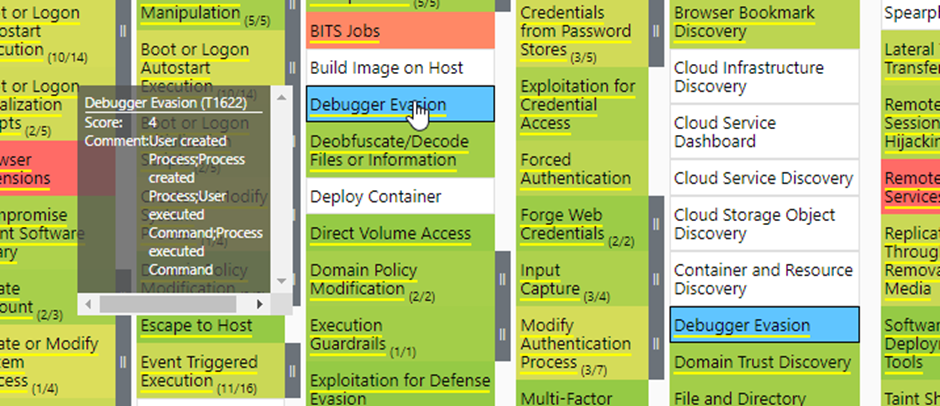
When we plot this in the table form with Python, we see this is correct:
mapping[(mapping['technique_id']=='T1622')][(mapping['log_source']=='Microsoft-Windows-Security-Auditing')]
The comments
As explained in the Score section, the comments contain the values of the column that was set in the commentProperty parameter. You can choose any column you like to be included in the comments section of the techniques. However, if you would like to compare layers with each other, it makes more sense to compare them with the 'name' column since these tell what is being detected
Comparing MITRE ATT&CK layers
Now that you have a basic understanding of how I can create MITRE layers with OSSEM, it is time to gather some insights by comparing layers.
MDE VS Windows Security Events
The first layers we are going to compare is the MDE and Windows Security Events layer. These layers are representations of all the data you can log with the two data connectors, and how they are mapped to MITRE. This does not mean that when you enable these data connectors in Sentinel, this will be your data coverage mapping. It only shows what the potential is of both connectors.
MDE mapping
To create the MDE mapping, I use the following commands:
# Microsoft Defender for Endpoint layer
techniques = get_mitre_techniques_by_filter('log_source','Microsoft Defender for Endpoint', techniquesArray=[], commentProperty='name')
create_mitre_mapping(techniques=techniques, template=mitre_layer, filename='Microsoft Defender for Endpoint.json')
You can download the JSON mapping below, so you can import the mapping yourself in the MITRE ATT&CK Navigator. When you open the navigator, you will see the following layer:
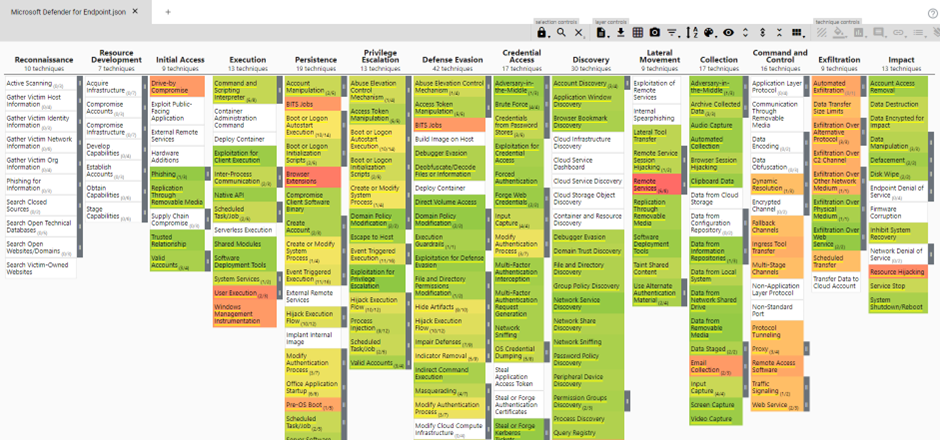
Windows Security Events mapping
To create the Windows Security Events mapping, I use the following commands:
# Microsoft-Windows-Security-Auditing layer
techniques = get_mitre_techniques_by_filter('log_source','Microsoft-Windows-Security-Auditing', techniquesArray=[], commentProperty='name')
create_mitre_mapping(techniques=techniques, template=mitre_layer, filename='Microsoft Windows Security Auditing.json')
You can download the JSON mapping below, so you can import the mapping yourself in the MITRE ATT&CK Navigator. When you open the navigator, you will see the following layer:
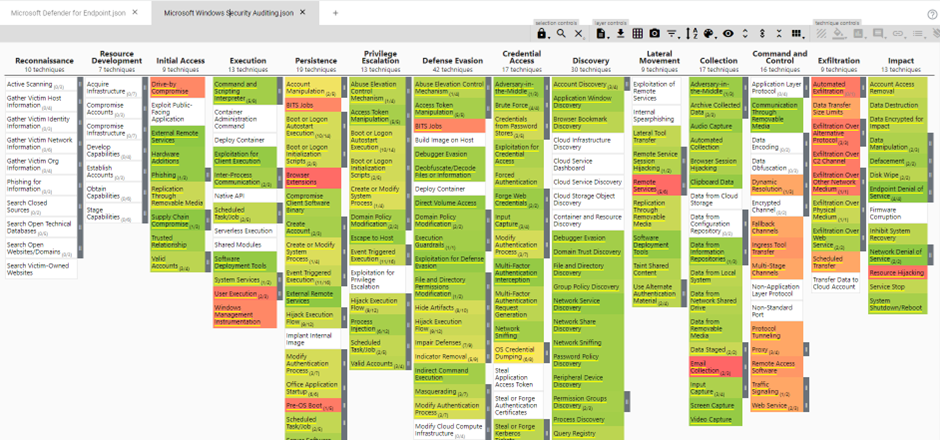
Comparing the layers
Before I start to compare the layers, I like to set the scale in both layers to the same maximum value. This way the colors of the techniques are comparable when you want to manually switch between the two layers. I always change the scale to the value of the layer that has the highest score. In this example, Microsoft Windows Security Logs has the highest score of 36, which means I also change the scale of the MDE layer to 36.
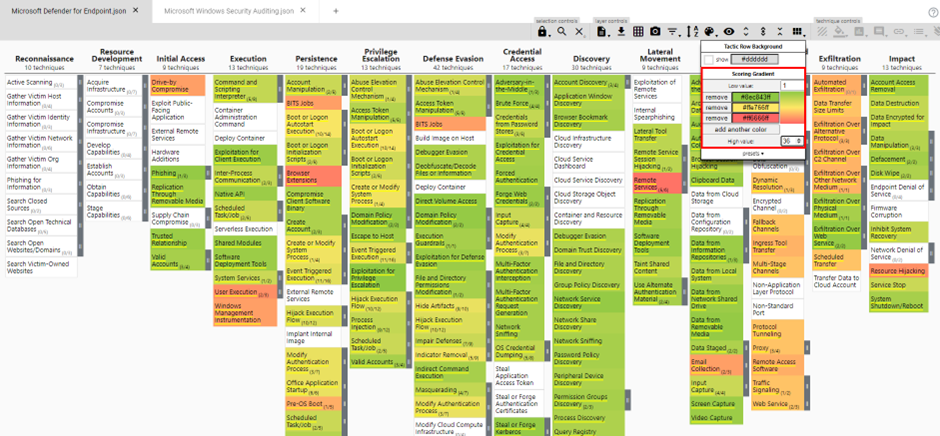
Now that the scales are the same, you can manually pivot between the two layers to compare which data source can map data to which techniques and compare which data source have most of the mappings to certain techniques. This can be very insightful information when you combine this with the most important techniques for your organization as described in my first MITRE ATT&CK blog post.
When you quickly want to find out which data source is the best for you, this process is not ideal since it can take some time. To speed things up, you can create a comparison layer between the two. To do this, create a new layer from the two other layers by choosing the v12 Enterprise layer, and create a score expression where you subtract the Windows Security Events layer from the MDE layer:
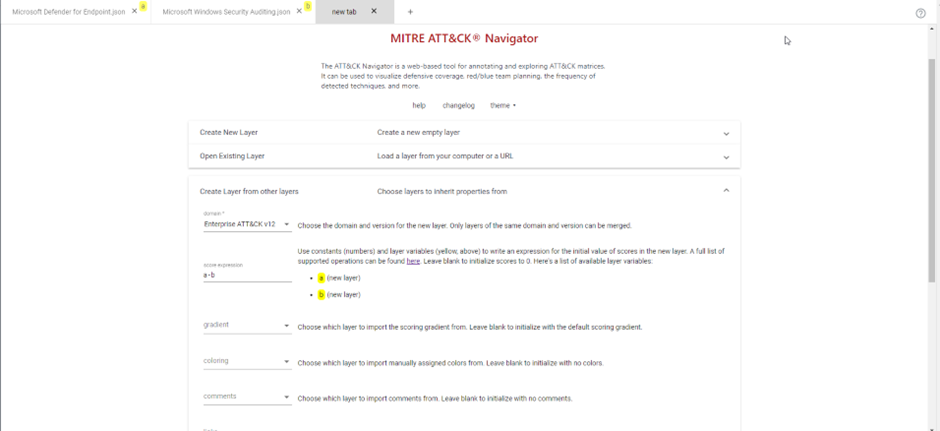
After that, you get a new layer that tells you nothing.
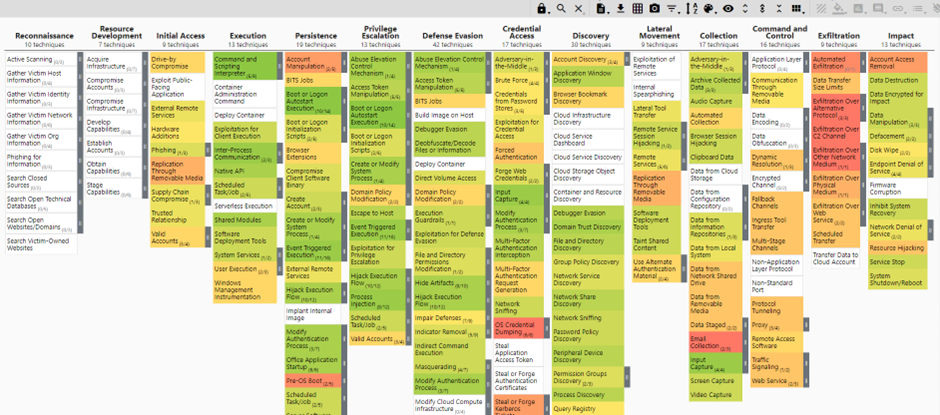
But we can fix this! Simply go to the score settings and change the maximal value to the positive value of the minimal (-9 and +5 become -9 and +9). Then set the -9 score to green, the middle score to white, and the +9 score to red. Fyi, if you ever create another comparison layer, just make sure both the minimal and maximal scores reflect the score of the highest absolute number.
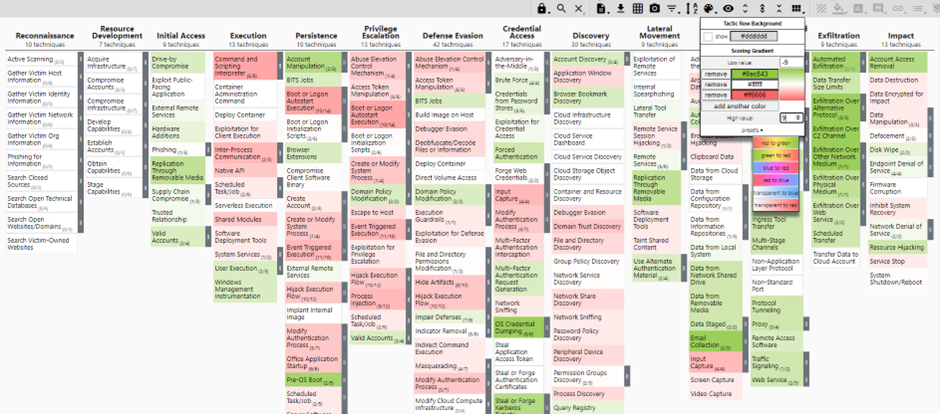
We now created a layer where techniques that have a green color are techniques where Microsoft Security Logs have more mappings, and techniques that have a red color are techniques where MDE has more mappings. This might be more useful when you try to decide which data source to use based on the techniques that matter the most to you. You can download this layer here.
Be careful! A technique that has a dark color does not mean that the technique does not have any mappings of the other data source. It is more like a scale representation of the differences between the data sources. Let's say you are interested in OS Credential dumping, from the comparison layer you will learn the Microsoft Security Logs have more data mapped to this technique:
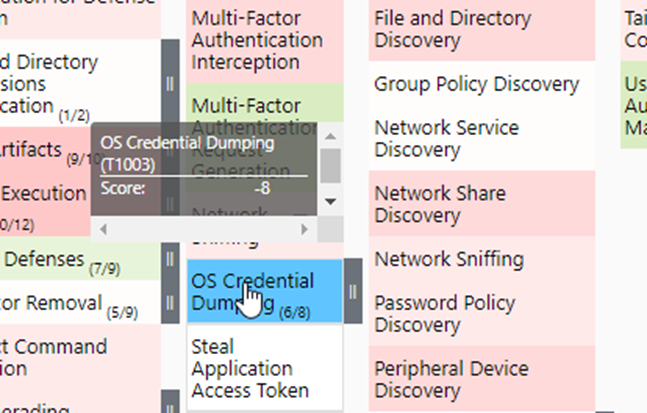
If you check this out in the Windows Security Logs layer and MDE layer, you will indeed see that Windows Security Logs have 8 more mappings than MDE has:
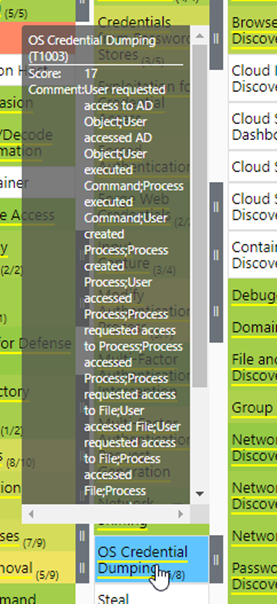
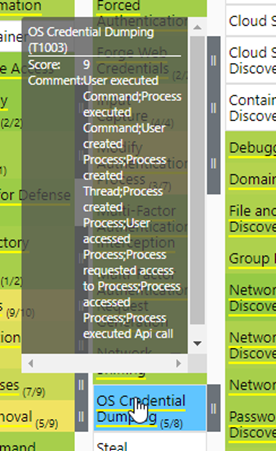
However, this does not necessarily mean that you must choose Windows Security Logs over MDE logs. When you check what MDE can map to this technique in the comments, this might be enough for your needs.
MDE VS Common Windows Security Events
If you have some experience with ingesting Windows Security Events in Microsoft Sentinel, you know that you have the option to choose between ingesting all, common, minimal, or customer Windows events. I think we can all agree that ingesting all Windows Security events is for a lot of organizations to expensive, which is why comparing the MDE VS Windows Security Events mapping might be less useful for some organizations. To solve this, I created a mapping for the common Windows Security events.
MDE mapping
I will not go into how the MDE layer is created, since we already covered that in the MDE VS Windows Security Events section. You can download
the MDE layer below.
Common Windows Security Events mapping
To be able to map the common events, we first need to know which events are included in the Common mapping. You can find the included events for common at this Microsoft learn page. To create the MITRE layer I used the following code:
# Event IDs in Sentinel 'Common' Security Events
commonEvents = [1, 299, 300, 324, 340, 403, 404, 410, 411, 412, 413, 431, 500, 501, 1100, 1102, 1107, 1108, 4608, 4610, 4611, 4614, 4622, 4624, 4625, 4634,
                4647, 4648, 4649, 4657, 4661, 4662, 4663, 4665, 4666, 4667, 4688, 4670, 4672, 4673, 4674, 4675, 4689, 4697, 4700, 4702, 4704, 4705, 4716, 4717,
                4718, 4719, 4720, 4722, 4723, 4724, 4725, 4726, 4727, 4728, 4729, 4733, 4732, 4735, 4737, 4738, 4739, 4740, 4742, 4744, 4745, 4746, 4750, 4751,
                4752, 4754, 4755, 4756, 4757, 4760, 4761, 4762, 4764, 4767, 4768, 4771, 4774, 4778, 4779, 4781, 4793, 4797, 4798, 4799, 4800, 4801, 4802, 4803,
                4825, 4826, 4870, 4886, 4887, 4888, 4893, 4898, 4902, 4904, 4905, 4907, 4931, 4932, 4933, 4946, 4948, 4956, 4985, 5024, 5033, 5059, 5136, 5137,
                5140, 5145, 5632, 6144, 6145, 6272, 6273, 6278, 6416, 6423, 6424, 8001, 8002, 8003, 8004, 8005, 8006, 8007, 8222, 26401, 30004]

# Common events layer
techniques_local = []
for event in commonEvents:
    techniques_local = get_mitre_techniques_by_filter('event_id',str(event), techniquesArray=techniques_local, commentProperty='name')
create_mitre_mapping(techniques=techniques_local, template=mitre_layer, filename='Common Security Events.json')
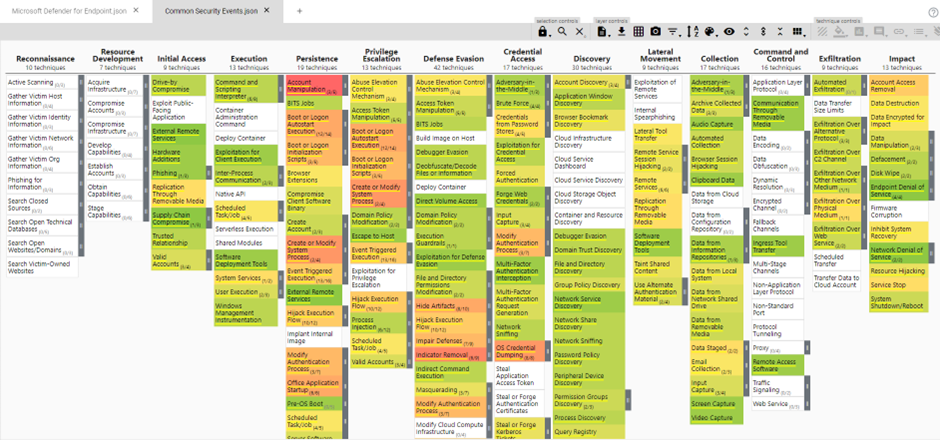
You can download the JSON mapping here, so you can import the mapping yourself in the MITRE ATT&CK Navigator. When you open the navigator, you will see the following layer:
Comparing the layers
I will not go into detail about how to set up the layers for comparing them with each other, since I already cover this in the MDE VS Windows Security Events section. If you create a comparison layer for both, you will now see that in general MDE has more data mappings than the Common Windows Security Events does:
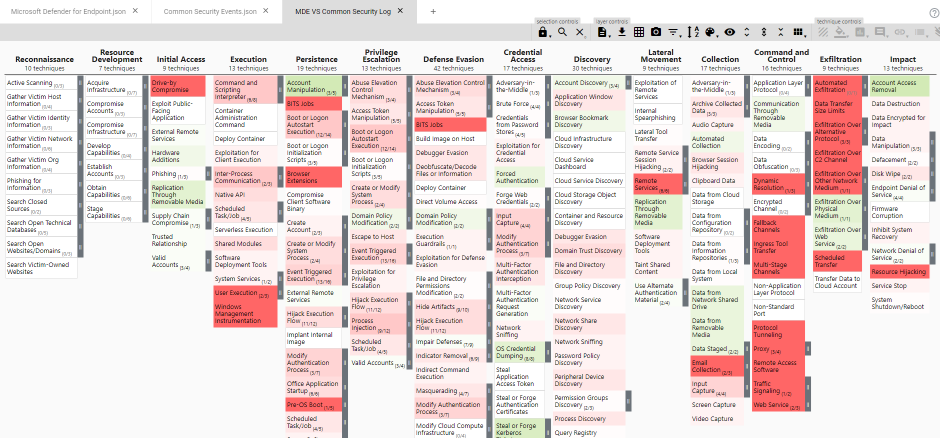
You can download this layer here.
Comparing and prioritizing layers
When you compare layers and create new ones as we did in the previous chapters, it might be interesting to weigh these layers with the techniques you are interested in. If you want to learn how to decide which techniques are the most important for your organization, make sure to read the first MITRE ATT&CK blog post of HybridBrothers.
Let's say you have a simple MITRE layer where every relevant technique for your organization has a score of 1, and all other techniques that are not relevant are disabled.
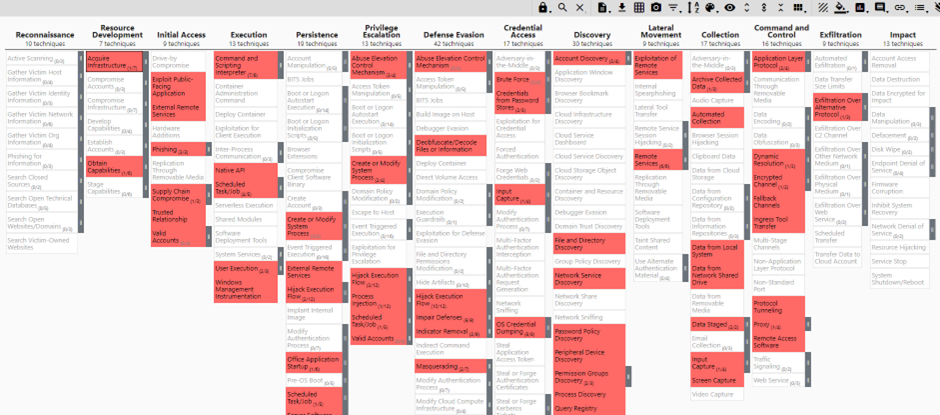
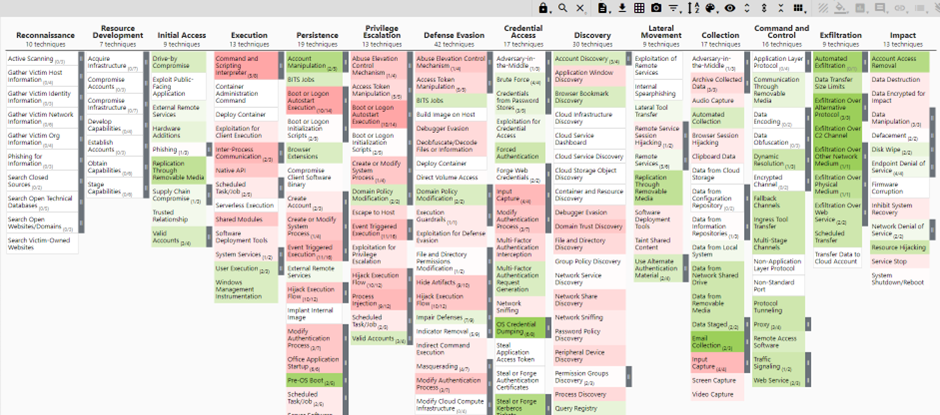
In this example we will be using the comparison layer of MDE and Windows Security Event logs:
To create a new layer of a comparison layer that has the weighting of the above prioritization layer, you need the following settings:
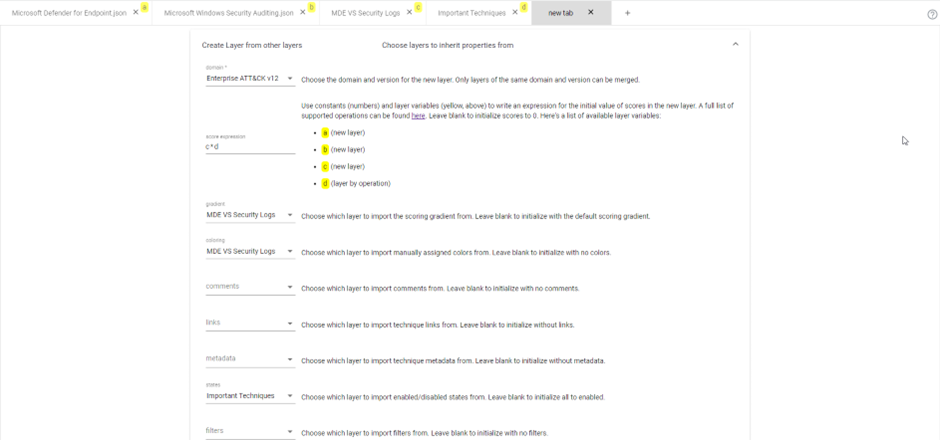
By doing this, we will reuse the score of the techniques in the comparison layer if the prioritization layer also has a score of 1 (since we multiply the two layers). When a technique does not have a score of 1 in the prioritization layer, the technique will get an empty score regardless of the score in the comparison layer. We reuse the gradient and colors of the comparison layer, so we get the same look and feel. Finally, we take the states of the prioritization layer since we always want to map techniques that are in the prioritization layer. When you do this, you will get something like the below:
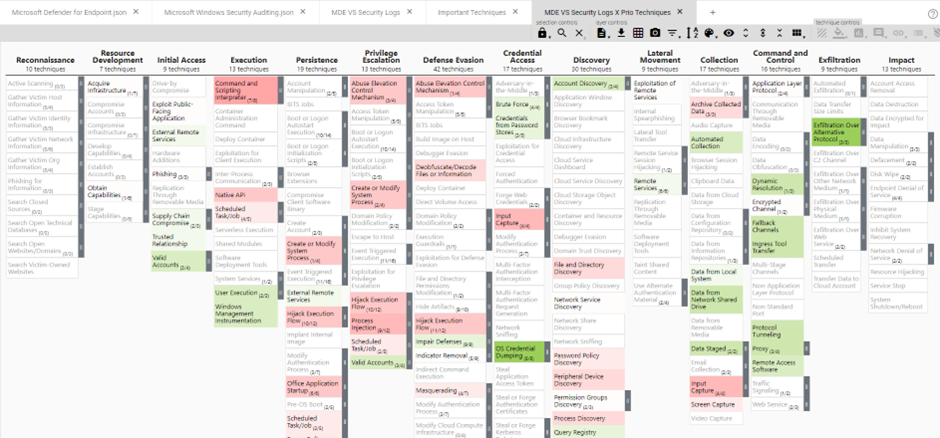
This layer only shows you the techniques of the prioritization layer, with the weighting and score of the comparison layer. By doing this, you only check techniques that are relevant for you. Keep in mind that the disabled techniques are techniques that were not present in the prioritization layer, and that enabled techniques without a score are techniques that were present in the prioritization layer but had empty scores in the comparison layer.
Finding MDE tables and Windows Event IDs based on MITRE layers
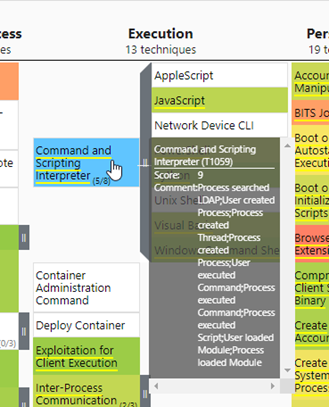
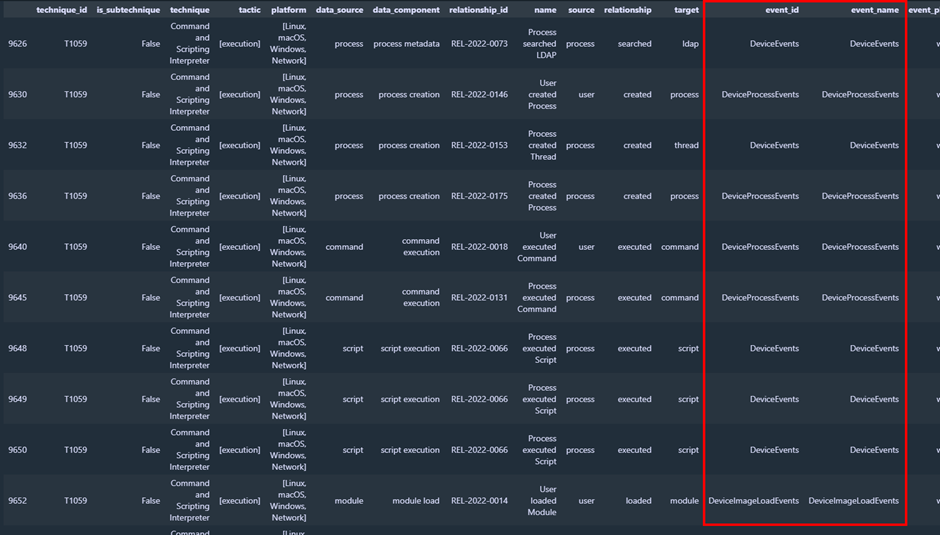
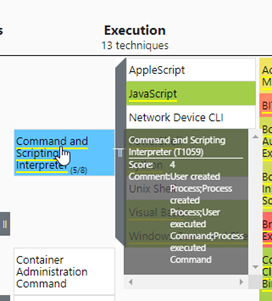
Now that we are able to create MITRE ATT&CK layers for MDE and specific Windows Security Event IDs, we can query the mapping data source in our Python script to look up tables and event IDs. Let's say that data related to 'Command and Scripting Interpreter' or detecting misuse of it is very important for your organization. By using the python script as explained in the 'Visualizing data' section of this post, you can find out in which table of MDE this data resides, or which event ids in Windows Security Logs relate to this data.
MDE
MITRE Layer:
Mapping query in Python:
mapping[(mapping['log_source']=='Microsoft Defender for Endpoint')][(mapping['technique_id']=='T1059')]Output:
Windows Security Events
MITRE layer:
Mapping query in Python:
mapping[(mapping['log_source']=='Microsoft-Windows-Security-Auditing')][(mapping['technique_id']=='T1059')]Output:

Conclusion, findings, and next steps
By following this blog post, you should have an understanding of how I was able to create MITRE mappings of the data coverage for both Microsoft Defender for Endpoints data and all or specific Microsoft Security Events using the OSSEM model.
Lessons learned
What we have learned during this post is that there are some overlaps of data in both MDE and Windows Security Events. This means that enabling both MDE raw logs and Windows Security Events logs in Microsoft Sentinel might not be a good idea without a proper reason to do so, since you will have duplicate data.
Another thing we learned is which data source has the most mappings to a certain technique. This might help in deciding which data source you will be using in your Sentinel environment, considering the types of events you will find in the data sources.
Once you correlate a comparison layer (for example, MDE VS Windows Security Events) and your prioritization layer with techniques that are important to you, you will have a better understanding of which data source to choose for the techniques that matter to you. You can also pivot back to the MITRE layers of the data sources themselves to find which data types are logged in the comments section of the technique, and you can use the table or graph mapping in the python script to find which event ids or tables you need to ingest the data you want.
Another valuable insight you might learn is which extra event ids you need to enable if you for example choose to rely on MDE data and want to fill gaps with Microsoft Security Events. You can use your prioritization layer and python graph or table mapping to find the needed event ids.
What we didn't learn
The most important one I want you to keep in mind is that we have mapped the RAW data capabilities of both data sources to the MITRE layer, which means we did not map the available detections in Microsoft Sentinel for each data source.
There might be reasons other than data coverage to choose a certain data source. Examples are the cost price of data ingestion and detection coverage of the data source. When you want to ingest MDE logs in Microsoft Sentinel, you are not able to choose for which devices you want to ingest the logs. This might lead to high costs when you for example only want to ingest MDE logs of servers but also have MDE deployed on client devices. When there are more analytic rules for Windows Security Events than MDE logs, the data coverage of MDE logs might be less relevant if it were to be that MDE has better data coverage, but Windows Security Events data coverage is acceptable for you.
Next related projects
As mentioned before, there are other reasons to choose a certain data source. One of them is the detection coverage of the data source. In Microsoft Sentinel, there is a MITRE blade that shows you the MITRE coverage of your current active analytic rules and the template analytics rules.
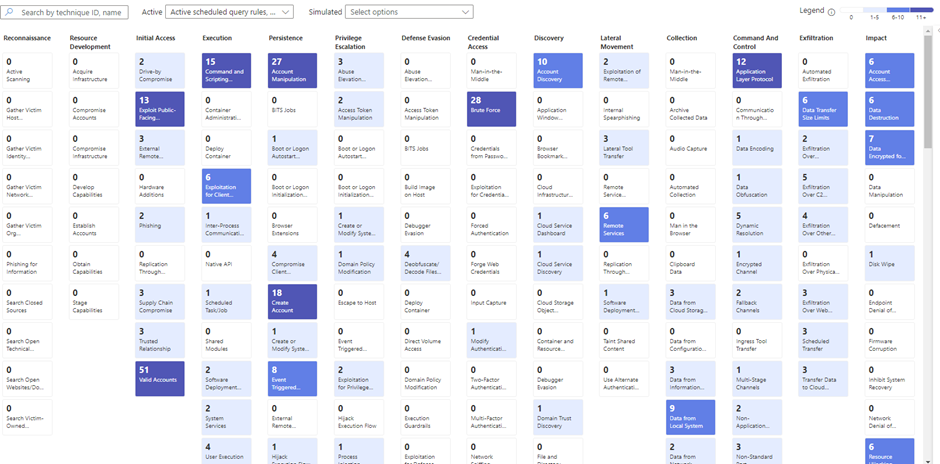
The thing I am missing in this blade is the possibility to filter on certain data connectors. To solve this issue, we are developing a script that is able to create the MITRE ATT&CK coverage for the template rules of specific data connectors. Once we have this, we will be able to create a much better decision on whether to use the MDE log in Sentinel, the Windows Security Events logs, or a combination of both.
If you are interested in the complete python code to create MITRE ATT&CK mappings based on the OSSEM model, let me know in the comment section below! If there is enough interest, I might share the GitHub repository where you can find:
- A Jupyter notebook with all the examples and code to map OSSEM to MITRE layers
- The MITRE layers discussed in this blog posts
- MITRE layers for Minimal Windows Security events in Windows Security events that are used in current out-of-the-box analytic rules
- A script that checks if you are ingesting all of the Windows Security Events that are used in out-of-the-box or custom-created analytic rules

